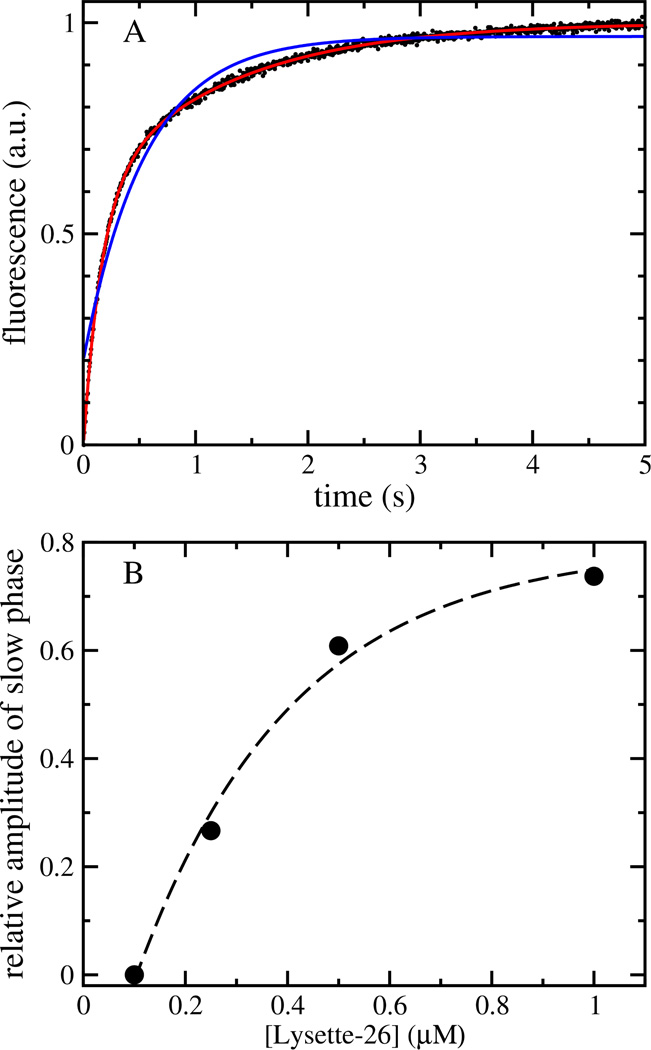
FIGURE 2.
Kinetics of lysette-26 binding to POPC LUVs. (A) Increase in the emission of 7MC-POPE as a result of peptide binding to lipid vesicles. Peptide concentration was 1 µM, and the lipid concentration, 100 µM. The experimental data (average of 10 individual traces) is shown as black dots. The blue line is a one-exponential fit, and the red line through the datapoints a two-exponential fit to the data. (B) Relative amplitude of the slower kinetic phase obtained from a two-exponential fit to data collectd as a function of peptide concentration. The data was obtained using a lipid concentration of 50 µM.

