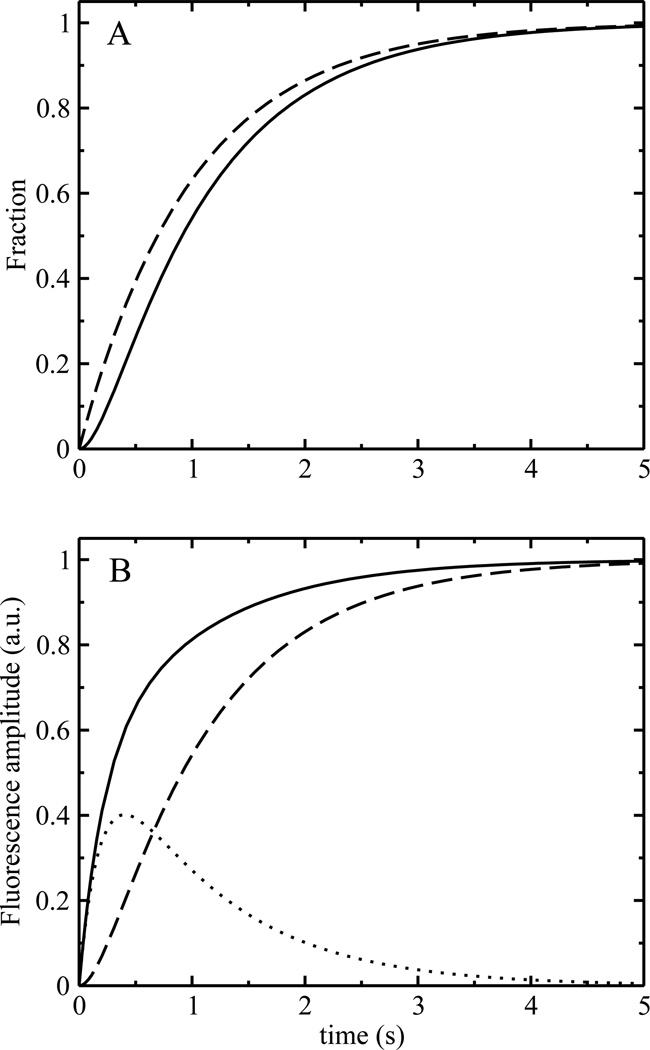
FIGURE 5.
Theoretical traces for a linear model of the type described in model IV. The two back-reaction rate constants were set to 0.1 s−1, which further simplifies the model to the one summarized by eq 11. (A) Evolution of the final state as a function of k1 and k2. Solid line: k1=1 s−1, k2=5 s−1. Dashed line: k1=1 s−1, k2=1000 s−1. (B) Theoretical signals for the intermediate and final state assuming that both contribute to the signal, k1=1 s−1, k2=5 s−1. Dashed line: final state, dotted line: intermediate state multiplied by a factor of 3, to indicate that the relative amplitude of this state to the overall signal was assumed to be three times that of the final state (see text). Solid line: overall signal, corresponding to the sum of the dashed and dotted lines.

