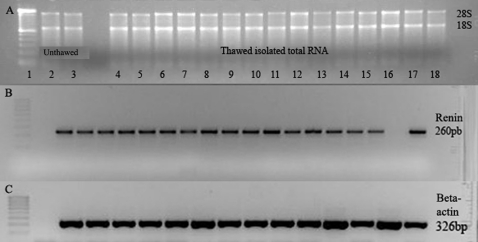
Figure 4.
A Integrity of the thawed and unthawed isolated total RNA samples. 1 = ladder; 2 and 3 = unthawed kidney (control); 4 to 18 = thawed isolated total kidney RNA. Figure 4B - Renin mRNA level in thawed isolated total kidney RNA. Figure 4C - β-Actin) mRNA level in thawed isolated total kidney RNA.

