
Figure 5.
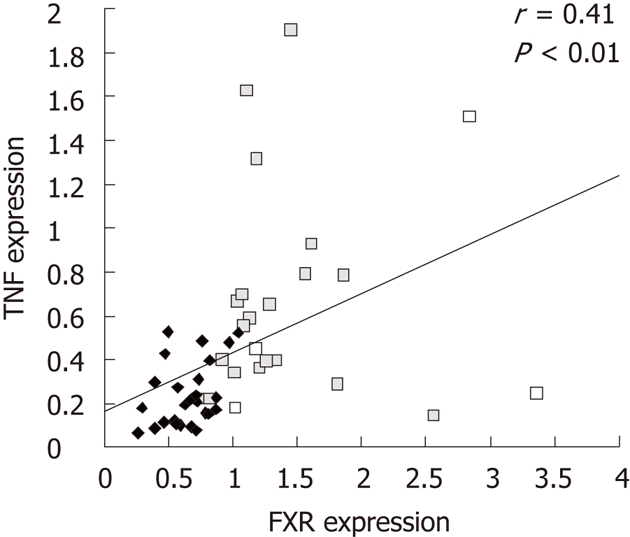
Correlation of tumor necrosis factor and farnesoid X receptor expression. Pearson’s correlation of tumor necrosis factor (TNF) and farnesoid X receptor (FXR) expression. Jejunal values are shown as black diamonds and colonic values as grey squares. Each dot represents an individual animal.