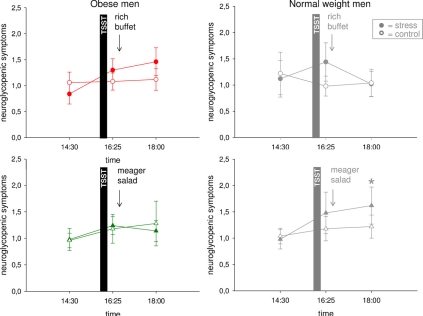
Figure 5.
Neuroglycopenic symptoms during stress intervention and non-stress control condition in obese men (colored symbols) and normal weight men (gray symbols). Social stress induced a neuroglycopenic state in normal weight, but that was not detectable in obesity. Original scale of neuroglycopenic symptoms ranges from 0 to 9. Legends as in Figure 2. *P < 0.05, significantly different from non-stress control condition, by dependent t-test.

