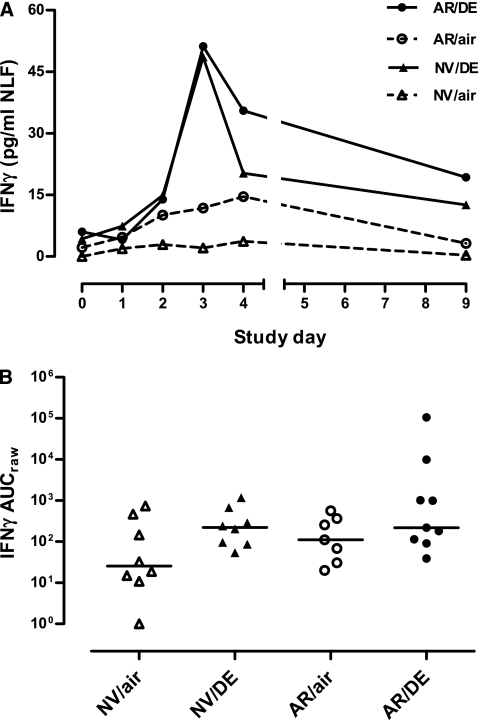
Figure 1.
(A) Time course of IFN-γ in nasal lavage fluid after Day 0 inoculation with live attenuated influenza vaccine (LAIV) in subjects exposed just before LAIV inoculation to clean air or to 100 μg/m3 diesel exhaust particles for 2 hours at rest. Data are shown as medians at each time point. (B) Individual area under curve (AUC) data for IFN-γ in nasal lavage fluid. Horizontal lines represent medians for each exposure group. AR/air = those with allergic rhinitis exposed to air; AR/DE = those with allergic rhinitis exposed to diesel exhaust; NV/air = normal volunteers exposed to air; NV/DE = normal volunteers exposed to diesel exhaust.

