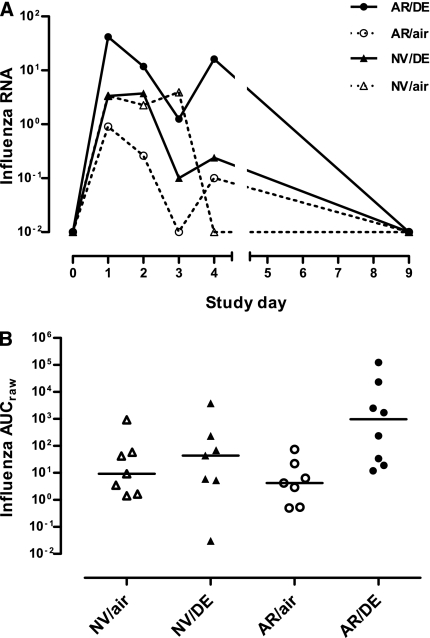
Figure 4.
(A) Time course of influenza virus RNA in nasal lavage fluid after Day 0 inoculation with live attenuated influenza vaccine (LAIV) in subjects exposed just before LAIV inoculation to clean air or to 100 μg/m3 diesel exhaust particles for 2 hours at rest. Data are shown as medians at each time point. (B) Individual area under curve (AUC) data for influenza virus RNA in nasal lavage fluid. Horizontal lines represent medians for each exposure group. AR/air = those with allergic rhinitis exposed to air; AR/DE = those with allergic rhinitis exposed to diesel exhaust; NV/air = normal volunteers exposed to air; NV/DE = normal volunteers exposed to diesel exhaust.

