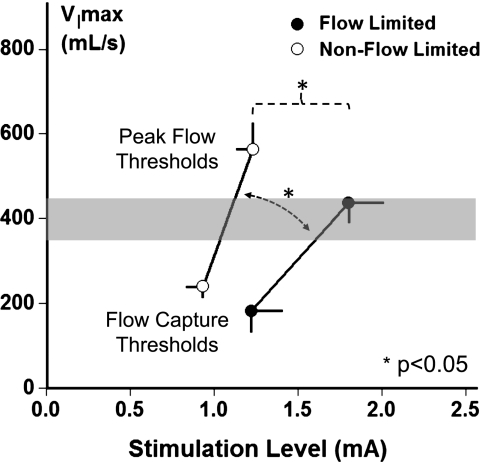
Figure 4.
Maximal inspiratory airflow (VImax) versus stimulation current (milliamperes) in groups with (solid circles) and without (open circles) inspiratory flow limitation at the peak flow threshold. The flow response slope in the non–flow-limited group was greater than that in the flow-limited subgroup (1241 ± 199 vs. 674 ± 167 ml/s/mA; n = 25; P < 0.05). Lower levels of stimulation current were required to achieve peak airflow in the non–flow-limited compared with flow-limited subgroup (1.23 ± 0.10 vs. 1.80 ± 0.20 mA; n = 25; P < 0.05), although peak inspiratory airflow did not differ between non–flow-limited and flow-limited subgroups (564 ± 58 vs. 438 ± 35 ml/s). Both groups attained normal or near normal levels during sleep of approximately 400 ml/s or greater (shaded region).

