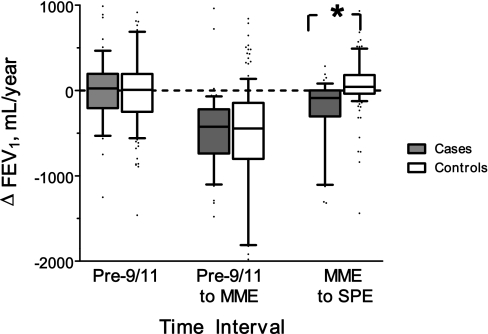
Figure 2.
Change in FEV1 (milliliter per year) significantly different between cases and control subjects only at medical monitoring examination (MME) to subspecialty pulmonary examination (SPE) time period. n = 237; * P < 0.0001. Slope was not statistically significant between cases and control subjects at pre–September 11th (n = 169) and between pre–September 11th to MME (n = 237). Results represented as box (median and interquartile range) and whiskers (10th–90th percentile). Significance determined by Mann-Whitney U test.

