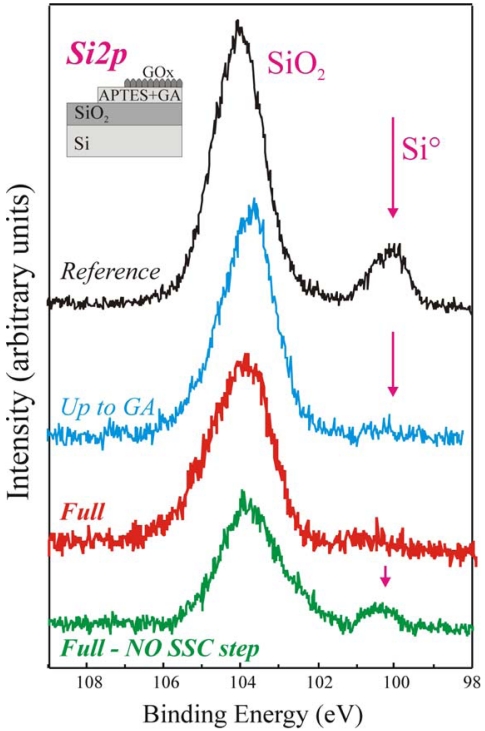
Figure 3.
High statistic acquisition mode XPS Si2p spectral regions of the reference (black line), up to GA (blue line), fully processed with SSC (GOx molecule, red line, Full) and fully process without SSC (green line, Full-NO SSC step) samples. A schematic of the immobilization steps is also reported (top left).

