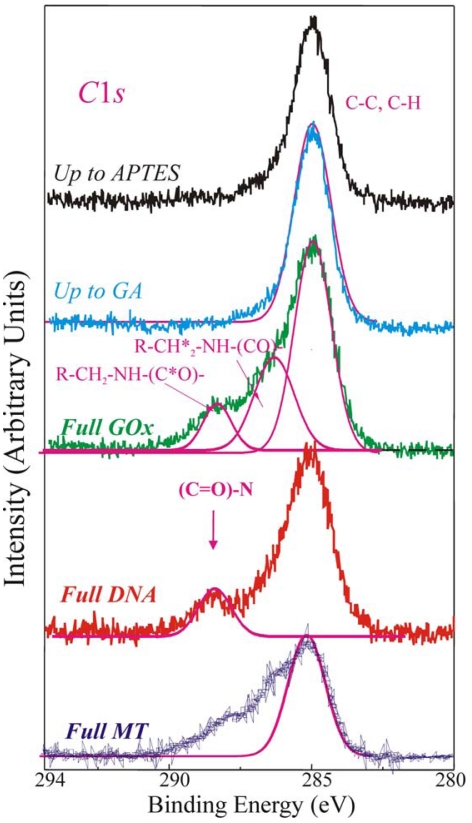
Figure 4.
High statistic acquisition mode XPS C1s spectral regions of: up-to-APTES (black line), up to GA (light blue line), fully processed with GOx (green line, Full GOx), fully processed with DNA (red line, Full DNA) and fully processed with MT (blue line, Full MT) samples. The magenta lines are the simulated peaks.

