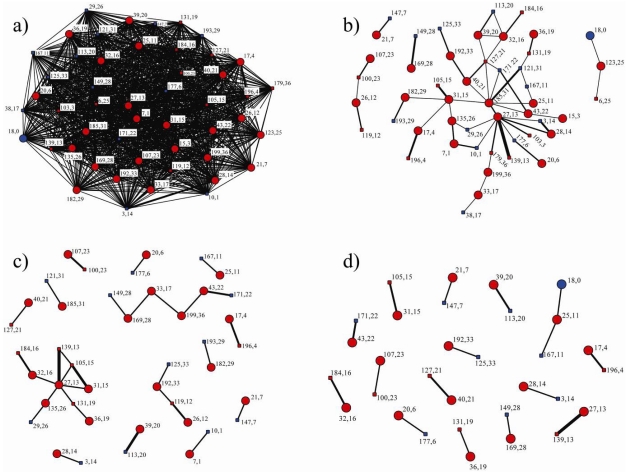
Figure 5.
Network diagrams representing total contact duration of contacts less than 5 m between animals logged by proximity loggers. (a) The complete network on day 2, based on 49 animals. (b) The network on day 2 where total contact time was greater than 40 minutes. (c) The network on day 4 where total contact time was greater than 60 minutes. (d) The network on day 6 where contact time was greater than 80 minutes. Isolates (those individuals with no contacts within the specified timeframe) in diagrams (b)-(d) have been removed. Key: colour: red = female, blue = male; shape: circle = adult, square = calf; label: first label is contact logger ID, second label is cow/calf pair code (same pair code equals identified cow/calf pair); thickness of lines represents association strength.

