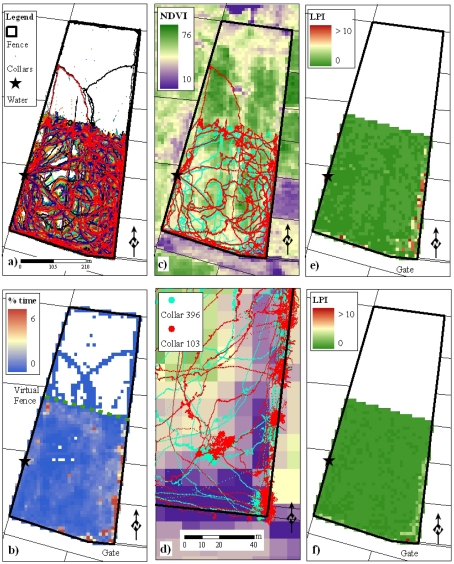
Figure 6.
(a) The trajectories of 36 animals over three days in a paddock at Belmont Research Station. (b) Percentage of time during the experiment animals spent in each pixel. (c) Trajectories of two animals overlaid on satellite-derived NDVI values. (d) Same as (c) zoomed into the bottom right corner of the paddock. (e) LPI for each pixel in front of the fence based on the proportion of NDVI in this area for animal number 103. (f) Same as (e) for animal number 396.

