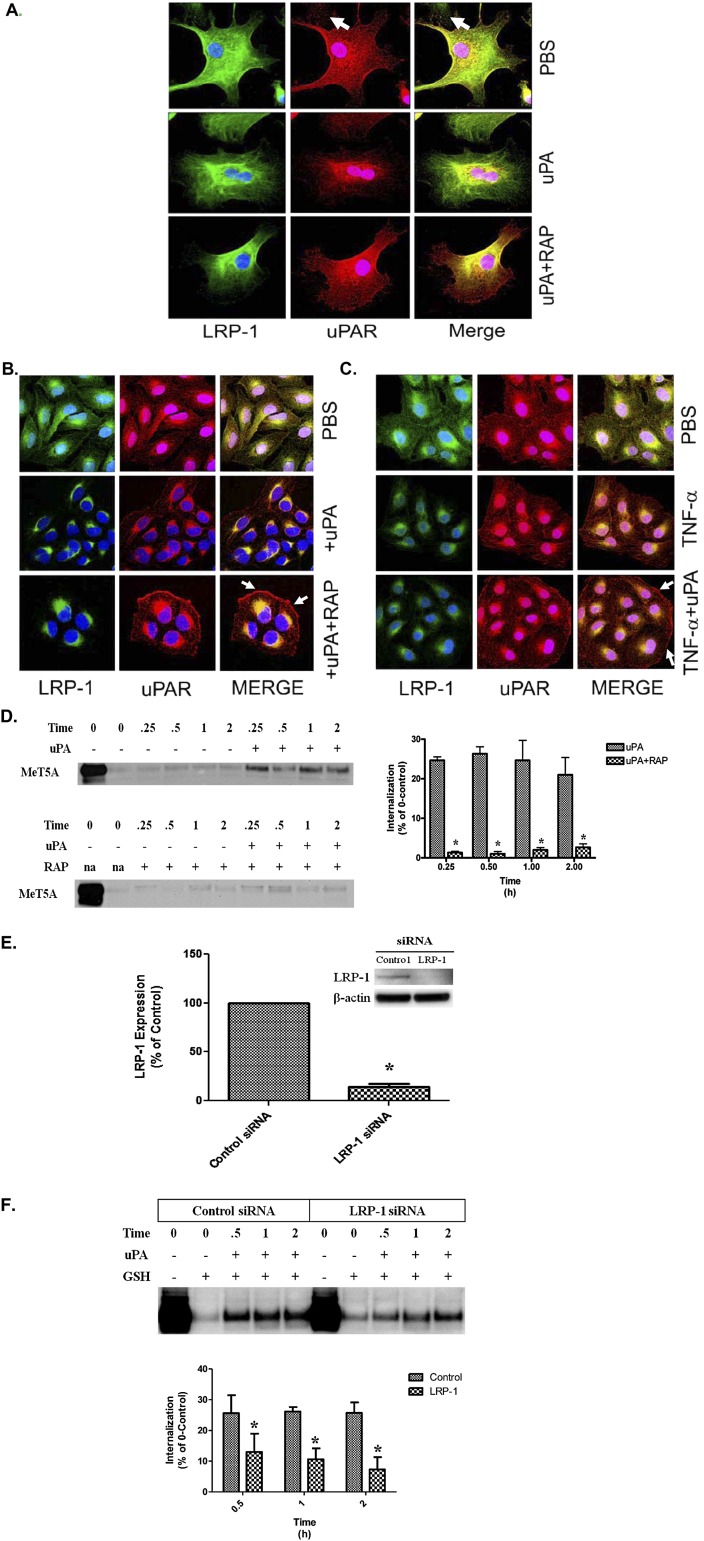
Figure 3.
Immunofluorescence labeling of uPAR and LRP-1 in uPA-treated PMCs. (A) Serum-starved HPMCs were treated in the presence or absence of 200 nM RAP for 15 minutes at 37°C. The cells were then incubated in the presence or absence of 20 nM uPA for 30 minutes at 37°C. The cells were fixed, permeabilized, and immunofluorescence labeled for uPAR and LRP-1 expression. (B) Serum-starved MeT5A cells were treated with 20 nM uPA in the presence or absence of RAP for 30 minutes at 37°C. The cells were then fixed, permeabilized, and labeled by immunofluorescence for uPAR and LRP-1 expression. Solid arrows indicate the presence of uPAR at the cell surface in uPA/RAP-treated cells. (C) Serum-starved MeT5A cells were treated with TNF-α for 15 to 18 hours in serum-free medium (SFM). The cells were then incubated in the presence or absence of 20 nM uPA for 30 minutes at 37°C. The cells were fixed, permeabilized, and labeled by immunofluorescence for uPAR and LRP-1 expression. Solid arrows indicate the presence of uPAR at the cell surface in uPA/TNF-α–treated cells. (D) Serum-starved MeT5A cells were treated with uPA in the presence and absence of 200 nM RAP. After incubation for 0.25, 0.50, 1, and 2 hours, the cells were subjected to GSH washes, lysed, and probed for uPAR internalization. Serum-starved MeT5A cells were surface biotinylated and incubated in the presence and absence of 20 nM uPA for 0, 0.25, 0.5, 1, and 2 hours. At the completion of the incubation periods, the cells were treated with GSH to remove remaining cell surface biotin. The designated 0 time point represents the total amount of uPAR on the cell surface at the time of biotinylation and is assigned a value of 100%. The graphs illustrate the percentage of the initial 100% of uPAR that was internalized. Internalized protected biotinylated protein was then isolated from lysates, and Western blot was performed to detect uPAR. (E) MeT5A cells were transfected with control or LRP-1 siRNA. Cells were then cultured in complete RPMI media for 24 hours and placed in SFM for 15 to 18 hours. Cells were then probed for LRP-1 expression by Western blot. β-actin was used as a loading control. The data represent the average of three independent experiments. *P < 0.05. (F) MeT5A cells were transfected with control or LRP-1 siRNA. Cells were then cultured in complete RPMI media for 24 hours and placed in SFM for 15 to 18 hours. Cells were surface biotinylated and incubated in the presence and absence of 20 nM uPA for 0, 0.5, 1, and 2 hours. At the completion of the incubation periods, the cells were treated with GSH to remove remaining cell surface biotin. The 0 time point indicates the total amount of uPAR on the cell surface at the time of biotinylation and is assigned a value of 100%. The bar graphs represent the percent of the total 100% of uPAR that was internalized into the cells from the cell surface in response to uPA treatment. *P < 0.05. The images are representative of at least three independent experiments.

