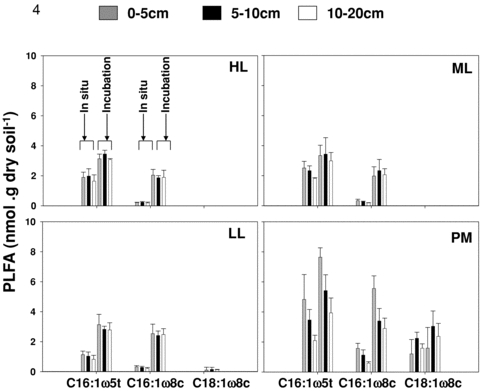
Figure 4.

Abundance of PLFA (phospholipid-derived fatty acids) specific for methanotrophic subgroups (C16:1ω5t and C16:1ω8c for type I MOB, C18:1ω8c for type II MOB) as derived from soil cores sampled May 2000 in four plots covering differences in flooding regime. Cores were subsectioned into three soil layers (0–5 cm, 5–10 cm, and 10–20 cm). Bars represent the mean ± standard deviation of four replicate samples per site. Depicted are bars indicating PLFA abundance as directly extracted from field samples (in situ) and PLFA extracted from slurries at the end of methane oxidation assays (incubation).
