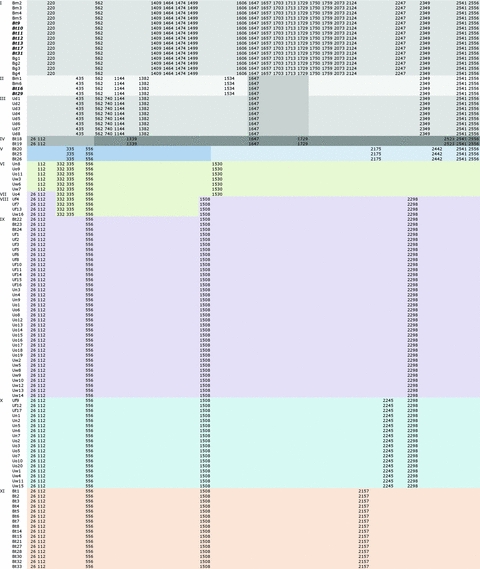
Figure 2.

Composition of 39 polymorphic sites for each sample of 11 groups reflecting 11 haplotypes. The group is labeled in the first column, the sample in the second column (see Table 1), and the composition in the columns 3–41. The pale flax samples from western Turkey are highlighted with italic and bold. The numbers in the composition columns are the positions of substitutions. Different background colors were used to make the haplotype identification easier.
