
Figure 2.
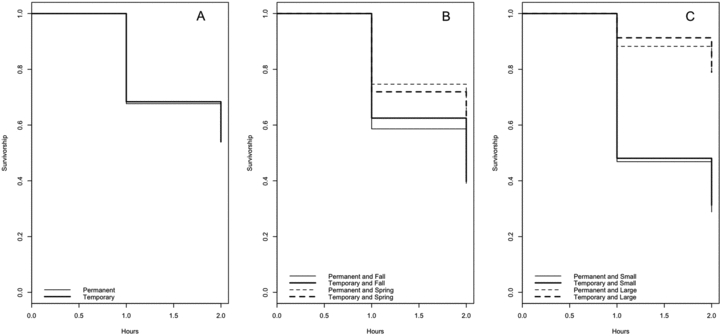
Kaplan–Meier survival curves for juveniles: the proportion of surviving individuals function of hours spent under the desiccation treatment. (A) Combined for both habitats: Permanent and Temporary. (B) For both habitats considering the rearing season: spring and fall. (C) For both habitats considering body size: small and large.