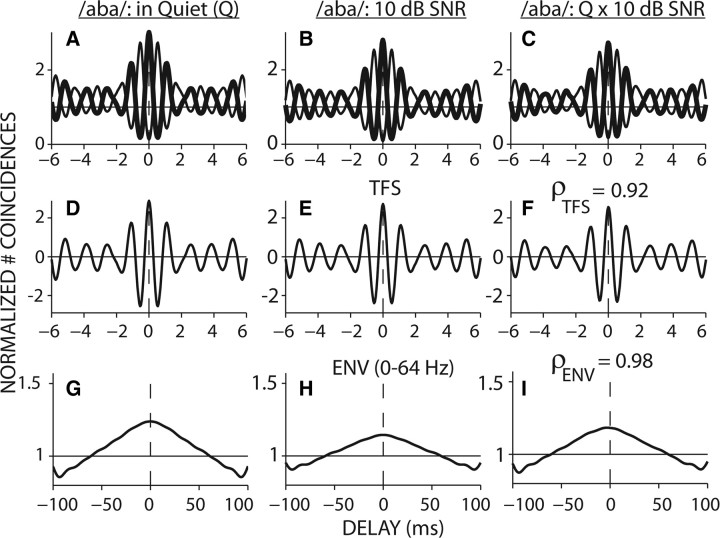
Figure 1.
Correlogram analyses to quantify the neural coding of ENV and TFS in noise-degraded speech. Columns 1 and 2 show temporal coding of /aba/ in quiet (Q) and for a 10-dB SNR, respectively; column 3 illustrates the similarity in temporal coding between these two conditions. A, B, Normalized shuffled auto correlograms (thick line) and cross-polarity correlograms (thin line). C, Shuffled cross-stimulus correlogram (thick line) and cross-polarity, cross-stimulus correlogram (thin line). D–F, Difcors represent TFS coding, with ρTFS shown in F. G–I, Sumcors represent phonemic (0–64 Hz) ENV coding, with ρENV shown in I. Fiber CF = 1000 Hz.

