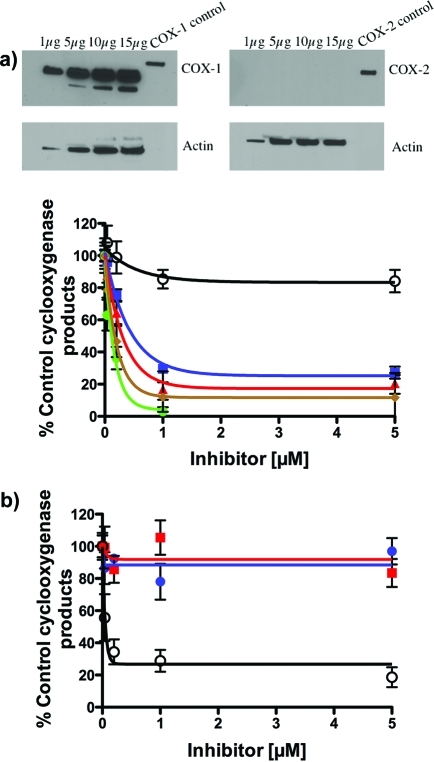
Figure 4.
(a) Inhibition of COX-1 in ovarian cancer cells. The OVCAR-3 human ovarian epithelial cancer cell line expresses high levels of catalytically active COX-1 but no COX-2 (see Western blot above).36 Whole-cell lysates from the OVCAR-3 human ovarian epithelial cancer cell lines were fractionated on a 10% PAGE and probed with polyclonal antibodies specific for COX-1 and COX-2. The control lane for the COX-1 blot is a standard solution of 0.3 μg/μL purified oCOX-1 in M-PER and Laemmli sample buffer, whereas the control lane for the COX-2 blot is a standard solution of 0.3 μg/μL purified mCOX-2 in M-PER and Laemmli sample buffer. Lower graph: Inhibition of hCOX-1 in OVCAR-3 cells (8 μM 14C-AA, 30 min at 37 °C) by E-DMSS analogues 2 (green circle; IC50, 116 nM), 13a (red triangle; IC50, 300 nM), and 21c (blue square; IC50, 495 nM) in comparison with literature reference compounds 5 (brown diamond; positive control; IC50, 160 nM) and 6 (○; negative control 16% inhibition at 5 μM). (b) Inhibition of hCOX-2 in HNSCC 1483 cells by E-DMSS analogues 2 (blue circle, n.i. at 5 μM) and 13a (red square, n.i. at 5 μM) in comparison with literature reference compound 6 (○; positive control; IC50, 54 nM).

