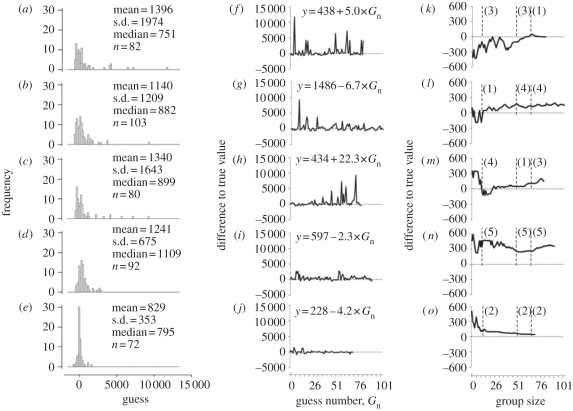
Figure 2.
(a,f,k) Data for sweet-guessing experiments where individuals had no public information, or (b,g,l) public information in the form: previous guess, (c,h,m) random previous guess, (d,i,n) mean average of previous guesses or (e,j,o) the best estimate from previous guesses. (a–e) Individual guesses represented as frequency histograms with relevant descriptive statistics. (f–j) How different guesses are from true values as a function of guess number. Regression equations for guess accuracy (Ga) against guess number (Gn) are also shown (see §2 for more detail). (k–o) SI accuracy (median of n guesses) as a function of group size. The rank SI accuracy of trials at group size 10, 50 and 70 are also shown for comparison (see also electronic supplementary material, figure S1).

