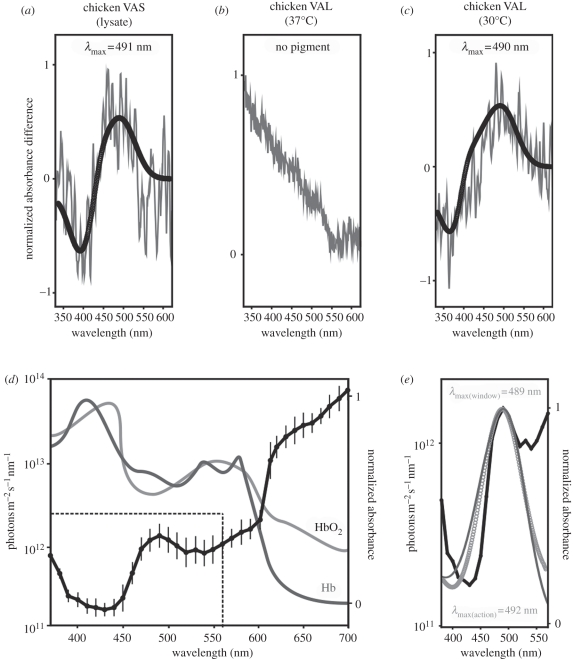
Figure 1.
(a) Absorbance difference spectra (grey line) for cVAS opsin photopigments extracted from hypothalamic lysates and (b) HEK293T cells transfected with cVAL and incubated at 37°C or (c) 30°C. λmax values are shown, as determined by fitting to a modified Govardovskii template [10,11] (black circles). (d) Spectral composition of sunlight reaching the basal hypothalamus (modified from [12]; black line) compared with the absorbance of oxygenated (HbO2; light grey line) and deoxygenated (Hb; dark grey line) haemoglobin (modified from [13]). Dotted box refers to the spectrum highlighted in (e), analysed within a physiological range for vitamin A1-based photopigments (λmax = 360–560 nm). (e) Spectrum of light penetrance at the avian hypothalamus (black line; modified from [12]), showing a ‘spectral window’ with a λmax at 489 nm when fitted to a vitamin A1-based template (light grey circles), compared with the action spectrum for the avian photoperiodic response (dark grey line) with a λmax at 492 (modified from [2]).

