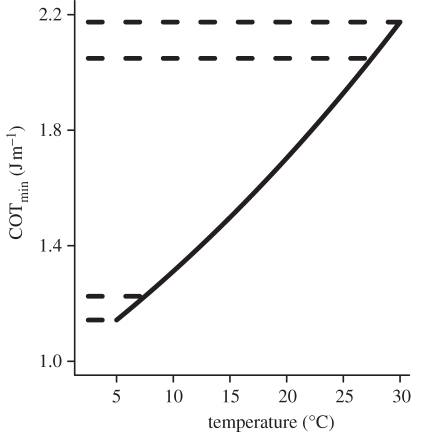
Figure 2.
COTmin as a function of temperature for a 1 kg fish. Solid line based on equation (2.2) and parameter estimates presented in text. Dashed lines show change in COTmin owing to an increase in temperature from 5°C to 7.5°C (0.08 J m–1, lower dashed lines) and 27.5°C to 30°C (0.12 J m–1, upper dashed lines).

