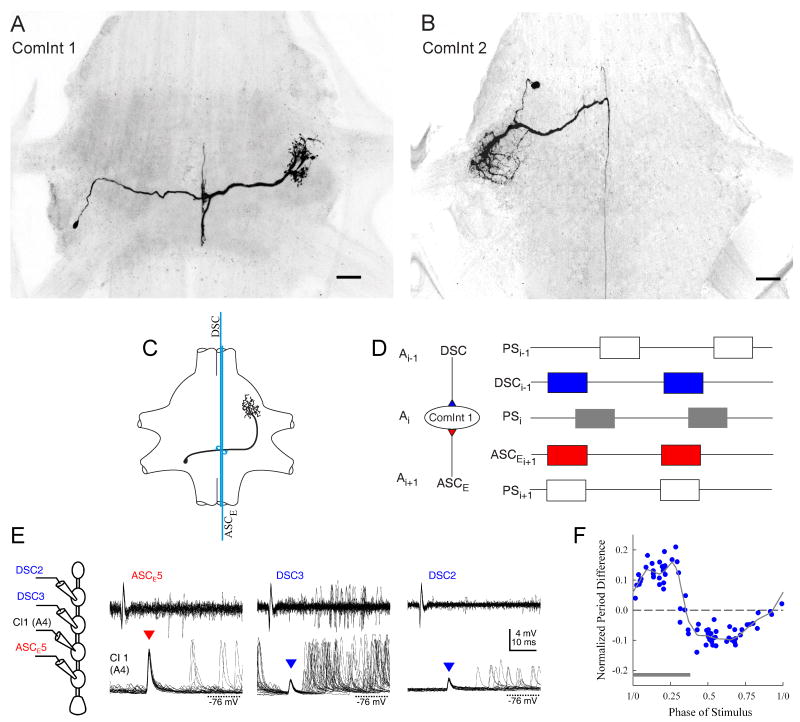
Fig. 8.
Commissural interneurons (ComInt) of the swimmeret system. (A) Whole mount of an A4 ganglion, viewed from the dorsal side with anterior at the top, that shows a dye-filled ComInt 1 neuron with its small cell body on the left side posterior to the base of N1. A thin process extends from the cell body to the midline, where it sprouts a tuft of small branches, and then continues on to the right LN where it branches repeatedly. The tuft of branches at the midline is aligned with the axons of coordinating neurons that project through the ganglion, and is the principal input region of each ComInt 1. The branches contralateral to the cell body are the neuron's principal output region. (B) Whole mount of an A3 ganglion (same orientation) that shows a dye-filled Commissural Interneuron 2 (ComInt 2). (C) Drawing of a ComInt 1 neuron receiving synaptic contacts from ASCE and DSC axons that originate in neighboring modules. (D) Diagram of the convergence of two coordinating axons (ASCE, DSC) from different ganglia onto the same ComInt 1 neuron. The box plots describe two cycles of swimmeret activity in three ganglia (Ai-1, Ai, Ai+1). Spikes in coordinating axons travel anteriorly from the next posterior ganglion (ASCE i+1) and posteriorly from the next anterior ganglion (DSC i-1) to converge simultaneously on the ComInt 1 neuron in ganglion Ai. The PS boxes show the posterior-to-anterior progression of PS bursts in neighboring ganglia (Fig. 2D). (E) Simultaneous intracellular recordings of EPSPs in a ComInt 1 neuron in A4 (CI1 (A4)) and extracellular recordings of spikes in ASCE and DSC neurons from ganglia A5, A3, and A2. Each panel shows multiple sweeps triggered by spikes in one coordinating axon (Smarandache et al., 2009). (F) Phase-response curve of a ComInt 1 neuron, generated by injecting pulses of depolarizing current into the neuron at different phases and measuring the change in period of the module to which the neuron projects. Positive changes mean longer periods, a phase-delay. The grey bar indicates when in each cycle the module's PS burst occurred.

