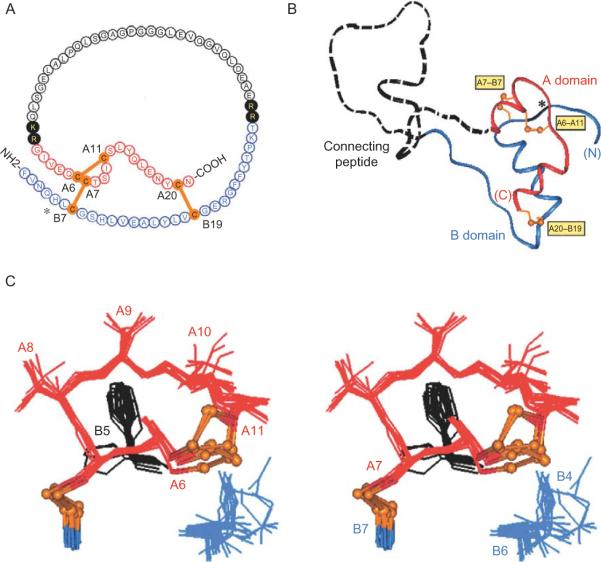
Figure 2.6.
Structure of proinsulin and T-state-specific environment of HisB5. (A) Sequence of human proinsulin: insulin moiety is shown in red (A chain) and blue (B chain). The connecting region is shown in black: flanking dibasic cleavage sites (filled circles) and C-peptide (open circles). (B) Structural model of insulin-like moiety and disordered connecting peptide (dashed line). Cystines are labeled in yellow boxes. (C) Structural environment of HisB5 within A-chain-related crevice. Structures are drawn from T-state coordinates given by PDB code in legend to Figure 2.3. This figure is reprinted from Hua et al. (2006a).

