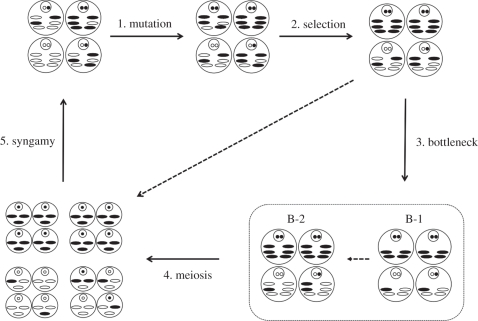
Figure 1.
Schematic of the life cycle. A representative sample of unicellular organisms (large circles) containing a number of haploid mitochondria (ovals) and a diploid nucleus (smaller circle) undergo steps 1–5 described in the main text. The mitochondria are shaded or left blank to represent the two states the mitochondrial genes may assume. The smallest circles in the nucleus represent nuclear genes that are shaded or left blank to represent the two states genes may assume. B-1 and B-2 are the two bottleneck stages as described in the main text. The dashed arrow represents the case where no bottleneck is assumed.

