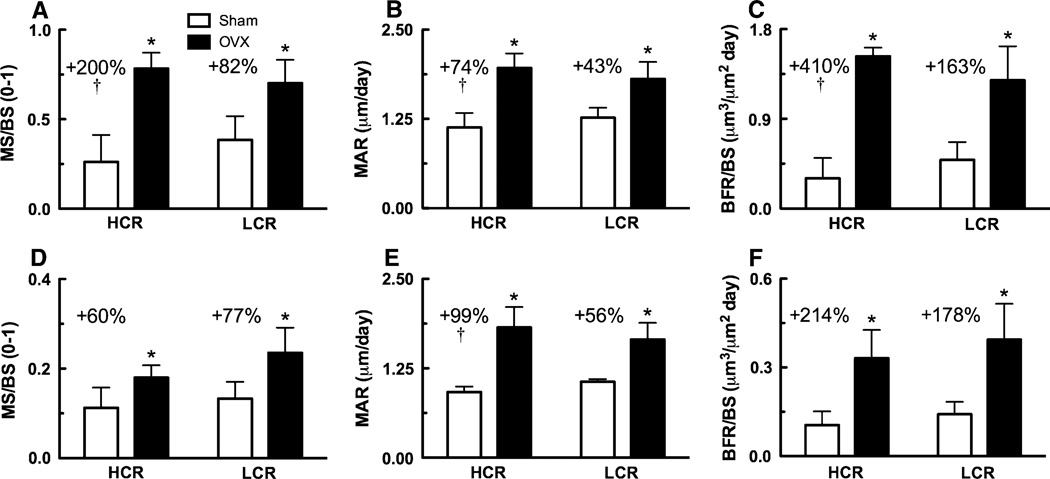
Fig. 3.
Dynamic histomorphometric measures from cortical bone of the femoral diaphysis and trabecular bone of the proximal tibial metaphysis. a Femoral diaphyseal periosteal (MS/BS), b mineral apposition rate (MAR), and c periosteal bone formation rate (BFR/BS). d Proximal tibial metaphyseal MS/BS, e MAR, and f BFR/BS. Percentages represent OVX levels relative to sham. † Upregulation of dynamic histomorphometric measure (i.e., OVX–sham) significantly greater in HCRs compared LCRs, * significantly different between surgery

