Figure 2.
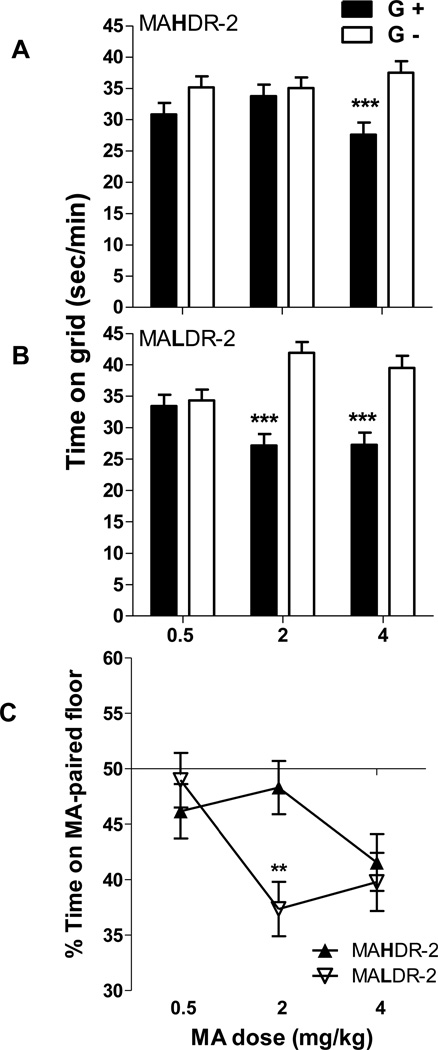
MALDR-2 mice display MA-induced conditioned place aversion (CPA) at a lower MA dose than MAHDR-2 mice. (A and B) Time in sec/min on the grid floor during a 30-min test for mice previously conditioned with MA on the grid (G+) or on the hole (G−) floor (n = 10–13 per line, group and dose). (C) Percent (%) time on the MA-paired floor by the same animals for the same 30-min test as for the data shown in A and B. Data are collapsed on conditioning group (G+ vs G−) and sex, due to the absence of significant effects of these factors; n = 20–23 per line and dose. Shown are means ± SEM. ***p<.001 for the comparison of G+ and G− at the specific MA dose. **p<.005 for the line comparison at the specific MA dose. MAHDR-2, MA high drinking replicate 2; MALDR-2, MA low drinking replicate 2.

