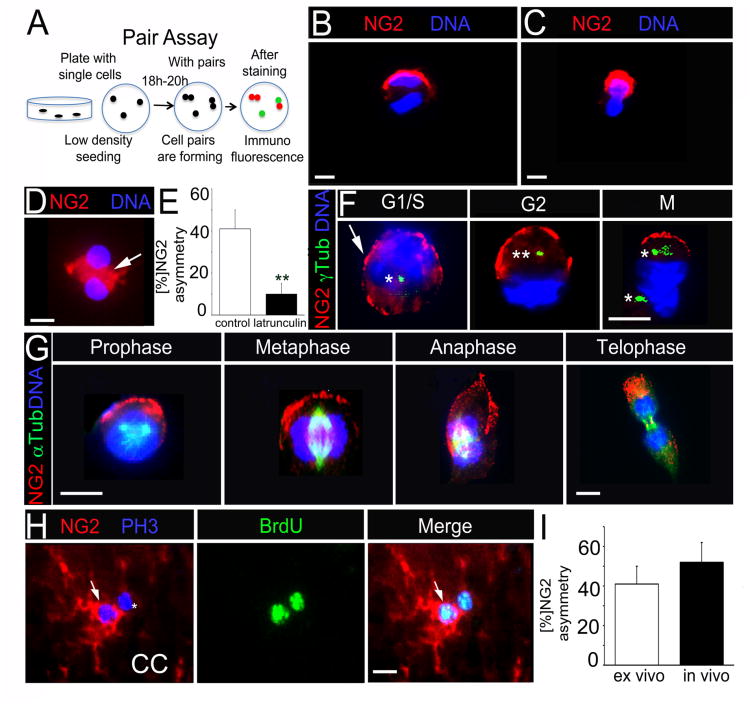
Figure 2. NG2 shows polarized localization and segregates asymmetrically in OPC.
(A) Schematic of pair assay. Single cells plated under proliferative conditions enter mitosis and form cell pairs, which are fixed and immunostained. Cell pairs in which proteins partition to one daughter cell are considered asymmetrical.
(B) A representative, neurosphere-derived mitotic cell pair with NG2 asymmetry.
(C) A representative acutely isolated cell pair with NG2 asymmetry.
(D) Cell pair treated with latrunculin A shows cytoplasmic (white arrow) rather then polarized NG2 localization.
(E) Percentage of cell pairs with NG2 asymmetry after latrunculin A and DMSO (control) treatment. **p=0.0087 by Student's t test.
(F) Immunofluorescent co-staining for NG2 and gamma (γ)–Tubulin (γ Tub) to label centrosomes. 1 asterisk = 1 centrosome. White arrow points to patchy NG2 staining in G1/S phase.
(G) Immunofluorescence co-staining for NG2 and alpha (α)-Tubulin (α Tub) to label the mitotic spindle.
(H) Representative cell pair in vivo with NG2 asymmetry after immunofluorescent co-staining for NG2, BrdU and PH3. P60 mice were injected with BrdU prior to sacrifice. White arrows point to NG2+ cell in pair.
(I) Percentage of cell pairs with NG2 asymmetry from acutely isolated cells (ex vivo) and CC tissue (in vivo).
Scale bars in (C), (D), (F), (G) and (H) 10 μm. Error bars are +/− standard error of the mean (SEM). (D; F; G) were performed with neurosphere-derived cells. See also Figure S2.

