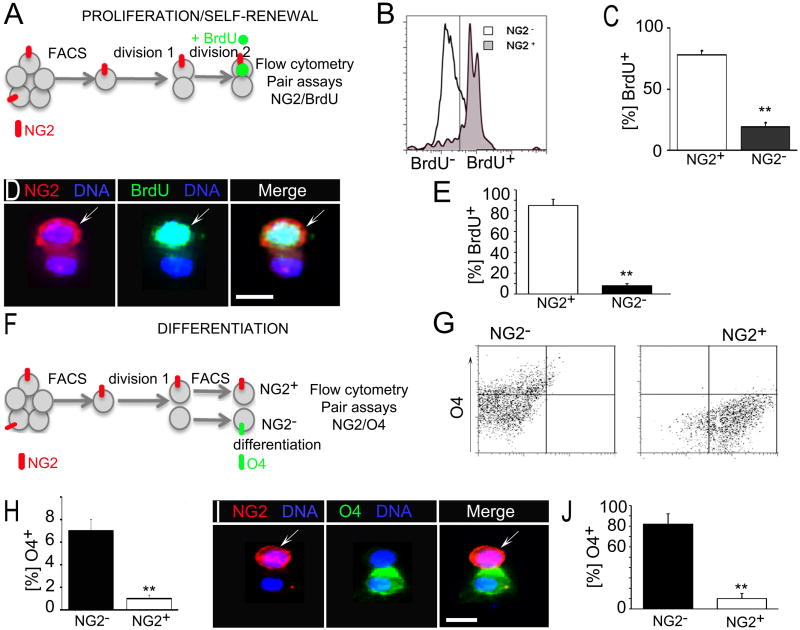
Figure 3. OPC undergo asymmetric cell division with NG2 tracking proliferative fate.
(A) Schematic of experimental approach to determine differences in proliferative cell fate. Acutely isolated NG2+ OPC divide into NG2+ and NG2− cells in proliferative medium for 48 hr (division 1). Cells were then treated with BrdU to label those re-entering division within the next 12 hr (division 2). BrdU+ cells in the NG2+ and NG2− progeny were quantified by flow cytometry (B, C) and in pair assays (D, E).
(B) A representative flow cytometry plot showing overlap between NG2 expression and BrdU incorporation. Grey line indicates border set between BrdU− and BrdU+ cells.
(C) Percentage of BrdU+ cells in the NG2+ and NG2− progeny.
(D) A representative cell pair with NG2 asymmetry immunostained for NG2 and BrdU.
(E) Percentage of BrdU staining in cell pairs with NG2 asymmetry.
(F) Schematic of experimental approach to determine differentiating fate. Freshly isolated OPC kept under proliferative conditions for 48 hr (division 1) were re-sorted into NG2+ and NG2−cells, switched to differentiation medium (differentiation) and percentage of O4 expression was assessed by flow cytometry 24 hr after sorting (G, H) and pair assays 48 hrs after plating (I, J).
(G) A representative flow cytometry plot for O4 expression in the NG2− (Left Plot) and NG2+ (Right Plot) population.
(H) Percentage of O4+ cells as determined by flow cytometry.
(I) A representative cell pair with NG2 asymmetry and co-immunostained for O4 and NG2.
(J) Percentage of O4 expression in cell pairs with NG2 asymmetry. Error bars are +/− standard error of the mean (SEM). Scale bars in (D) and (I) 10 μm. See also Figure S3.

