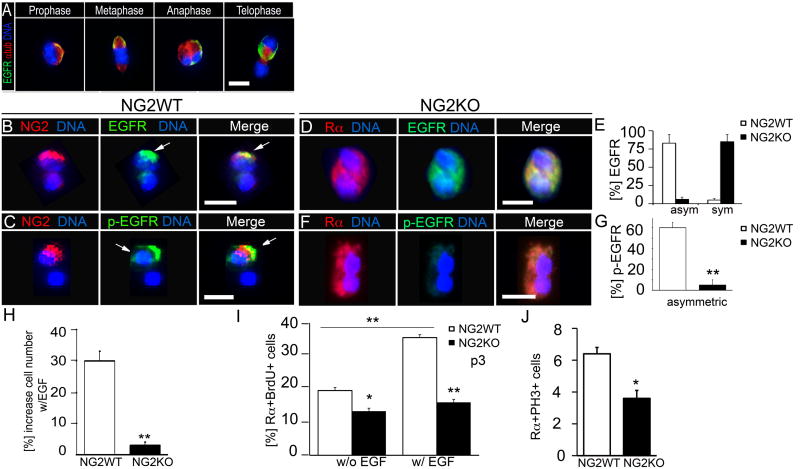
Figure 4. NG2 regulates EGFR asymmetry and EGF-dependent proliferation and self-renewal.
(A) Immunofluorescent co-staining for EGFR and a-Tubulin of neurosphere-derived cells at distinct stages of mitosis.
(B) A representative NG2+ OPC cell pair co-immunostained for NG2 and EGFR (white arrows).
(C) A representative NG2+ OPC cell pair co-immunostained for NG2 and p-EGFR (white arrow). EGF is present in medium.
(D) A representative NG2KO OPC cell pair co-immunostained for PDGFRα+ (Rα) and EGFR showing symmetric EGFR.
(E) Percentage of cell pairs with asymmetric (asym) and symmetric (sym) EGFR.
(F) A representative NG2KO OPC cell pair co-immunostained for PDGFRα+ (Rα) and p-EGFR showing symmetric, faint p-EGFR signal.
(G) Percentage of cell pairs with asymmetric p-EGFR staining.
(H) EGF-starved neurosphere cells were treated with EGF for 48 hrs and cell numbers were determined.
(I) Percentage of PDGFRα and BrdU double positive (Rα+BrdU+) cells with (w/EGF) and without (w/o EGF) EGF.
(J) Percentage of PDGFRα and PH3 double-positive (RαPH3+) cells. OPC were acutely isolated from the CC of P60 NG2WT and NG2KO mice using PDGFRα as selection marker with the exception of (A, H). There, OPC were isolated from low passage subcallosal zone-derived NG2WT and NG2KO neurospheres. Error bars are +/− standard error of the mean (SEM). **Students t-test p<0.01. *Student's t-test p<0.05. Scale bars in (C-D) and (F) 10 μM. See also Figure S4.

