
Figure 5. Asymmetric OPC divisions are decreased in a mouse glioma model.
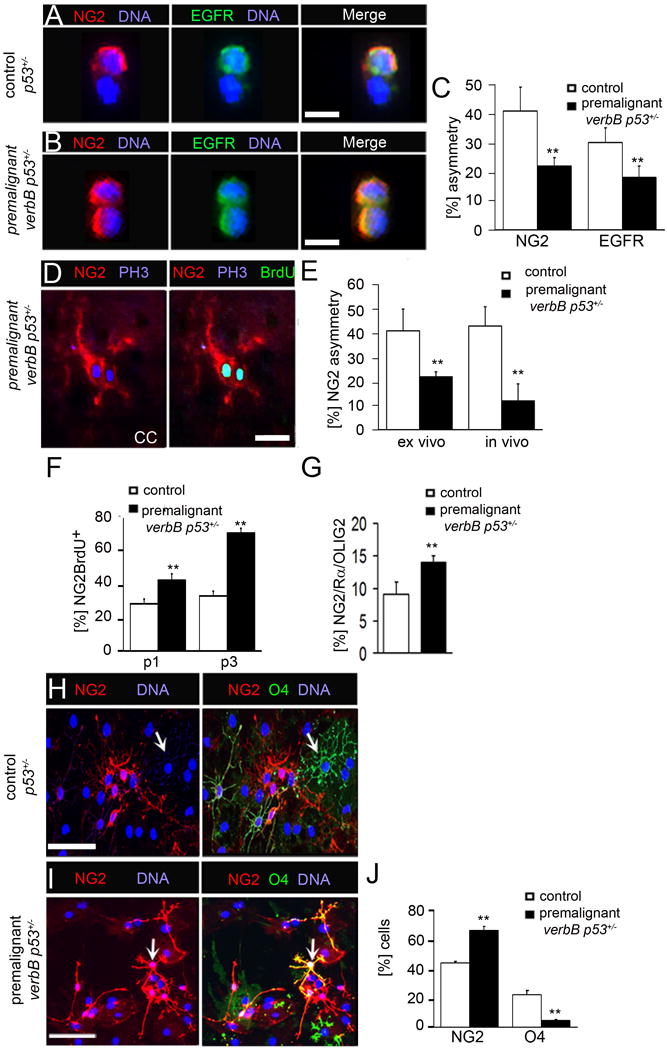
(A) A p53+/− OPC cell pair is stained for NG2 and EGFR.
(B) A verbB p53+/− OPC cell pair is stained for NG2 and EGFR.
(C) Percentage of NG2 and EGFR asymmetry in control and verbB p53+/− OPC following their acute isolation from CC tissue.
(D) An OPC cell pair in the CC of verbB p53+/− mice is stained for NG2, PH3 and BrdU.
(E) Percentages of NG2 asymmetry are 23% in acutely isolated (ex vivo) verbB p53+/− cells and 13% in verbB p53+/− tissue (in vivo), compared to 41% in acutely isolated control, p53+/− OPC and 42% in control, p53+/− CC tissue.
(F) Percentage of NG2+BrdU+ cells in verbB p53+/− OPC and control cells as determined by flow cytometry. 47% and 76% of verbB p53+/− cells at passage 1 (p1) and passage 3 (p3), respectively, are NG2+BrdU+.
(G) OPC numbers, as determined by quantifying triple-positive (NG2/Rα/OLIG2) cells, in the verbB p53+/− and the control CC tissues.
(H) Control and (I) verbB p53+/− OPC plated for differentiation and stained for NG2 and O4. (J) Percentage of NG2+ cells differentiated into O4+ cells 10 d after differentiation. O4 staining non-overlapping with NG2 in control cells (white arrow in H). In contrast, verbB p53+/− O4+ cells with overlapping NG2 staining (yellow staining; white arrow in I). O4 and NG2 double-positive cells were counted as O4+ cells.
Pair assays (A, B), self-renewal (F) and differentiation (H, I) experiments were done with acutely isolated NG2+ cells. Controls are p53+/−. Error bars are +/− standard error of the mean (SEM). **Student's t-test p<0.01. Scale bar in (A) and (B) 10 μM, in (D) is 50 μM and in (F) is 100 μM. See also Figure S5.