
Figure 6. Asymmetry-defective OPC initiate orthotopic tumors.
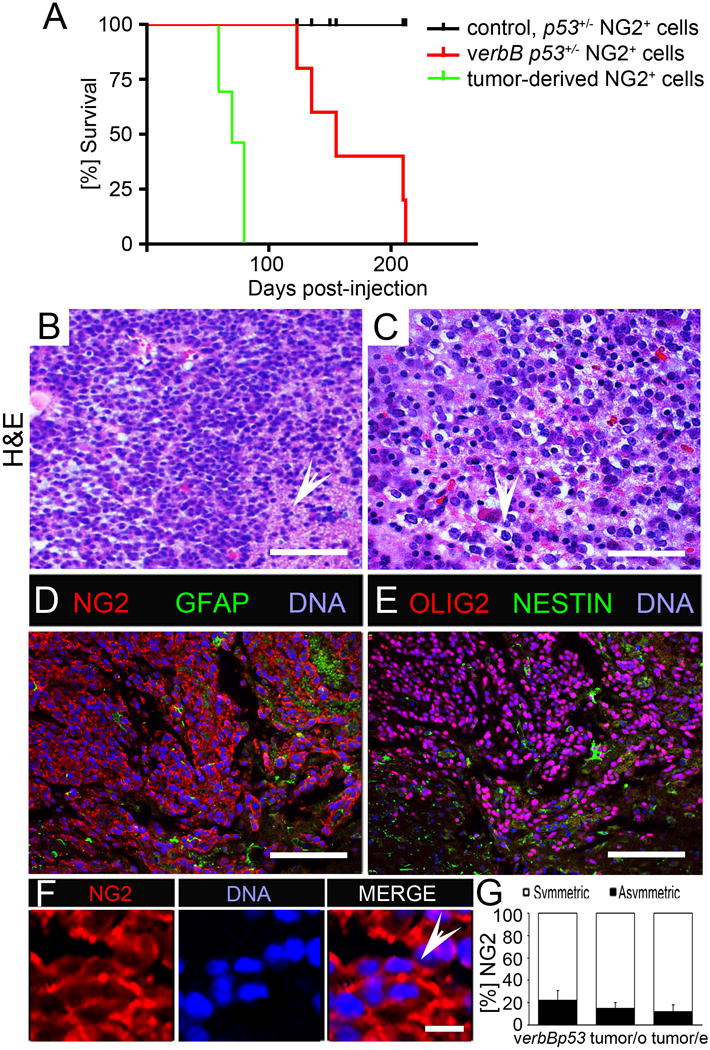
(A) Kaplan-Meier survival curves of mice injected with 100,000 p53+/−, verb p53+/− and tumor-derived NG2+ cells.
(B, C) Hematoxylin & Eosin (H&E) staining of orthotopic tumors from verb p53+/− NG2+ cells. The white arrow in panel B indicates infiltrative tumor cells and the white arrow in panel C indicates a cell with the “fried egg” appearance, a feature typical for oligodendroglial tumors.
(D, E) Immunofluorescent staining of orthotopic tumors for NG2 and GFAP (D) and for OLIG2 and Nestin (E).
(F) NG2 staining of orthotopic tumor at higher magnification. The white arrow points to a mitotic cell pair identified by nuclear staining with symmetric NG2.
(G) Percentage of cell pairs with symmetric (white area) and asymmetric (black area) NG2. NG2 asymmetry is 23% in acutely isolated verbB p53+/− cells and is 18% in cells isolated from orthotopic (tumor/o) and 10% in cells isolated from endogenous tumors (tumor/e).
Error bars are +/− standard error of the mean (SEM). Scale bars in (B), (D), (E) are 100 μM, in (C) 200 μM and in (F) 10 μM. Student's t-test, *p<0.05. See also Figure S6.