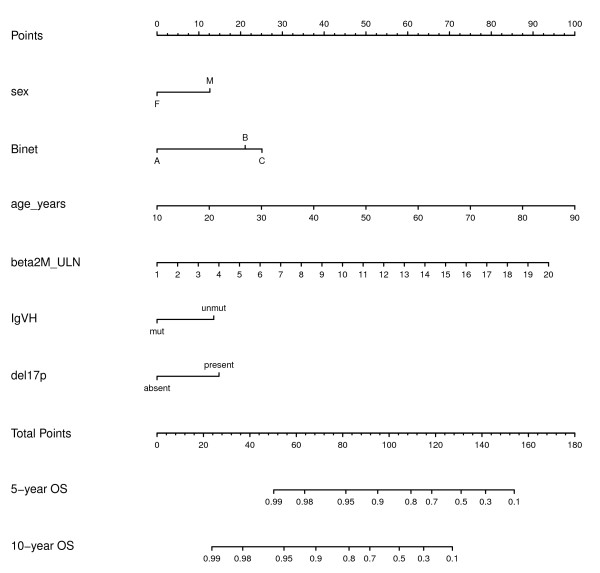
Figure 4.
Nomogram for predicting overall survival according to the clinical-biological prognostic index. To read the nomogram, draw a vertical line from each tick marker indicating the status of a predictor to the top axis labeled Points. Sum the points and find the corresponding number on the axis labeled Total Points. Draw a vertical line down to the axes showing 5- and 10-year overall survival rates and median survival. Beta2M, ß2 microglobulin; ULN, upper limit of normal; OS, overall survival.

