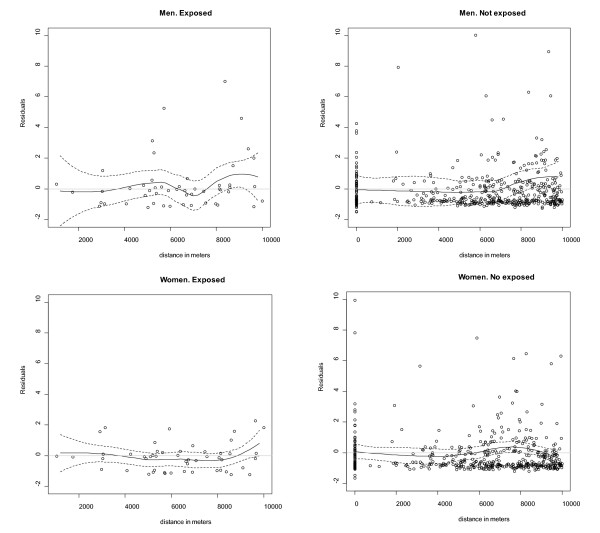
Figure 4.
Graphs of residuals vs distance. The straight line is the lowess smoother and the dashed lines are point wise 95% confidence bands. For non-exposed areas the represented distance is the distance from the municipal centroid to the centre of the area, dots with distance equal 0 are the municipalities located in the centre of each non-exposed area.

