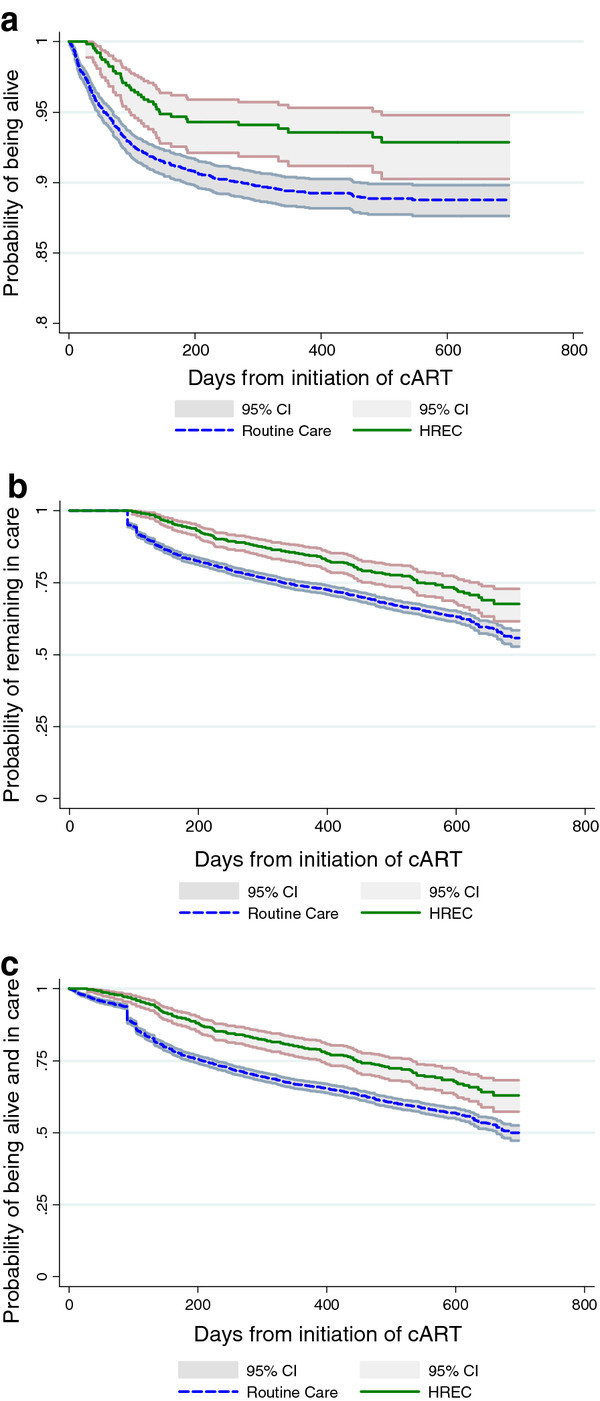
Figure 1.

Kaplan-Meier curves demonstrating the effect of the High Risk Express Care compared with Routine Care among all high-risk patients on: a) their probability of survival; b) their probability of remaining in care (i.e., loss to follow up); and c) their probability of remaining alive and in care (n = 4958). a Probability of remaining alive after cART initiation. b Probability of remaining in care after cART initiation. c Probability of remaining alive and in care after cART.
