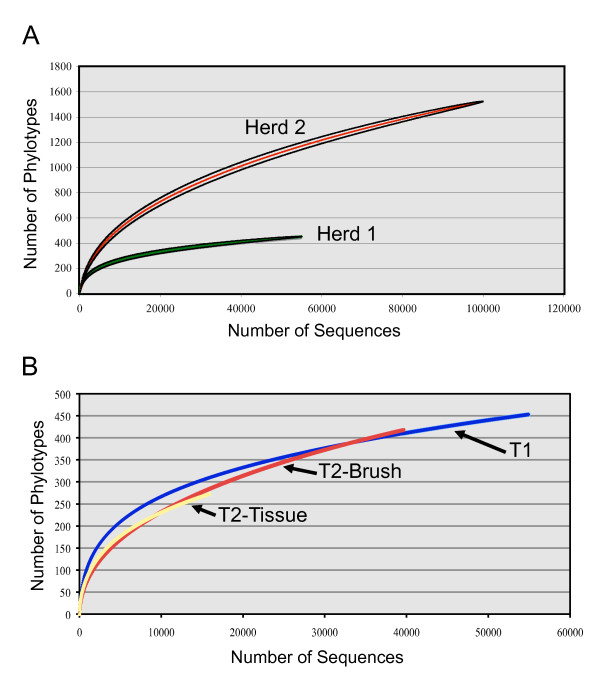
Figure 1.
Rarefaction curves computed with the RDP Pyrosequencing Pipeline. Rarefaction curves are presented for each group of samples obtained by 454 pyrosequencing. The curves for herds 1 and 2 at time 1 are shown in panel A, while the curves for all three groups of samples from herd 1 are shown in panel B.

