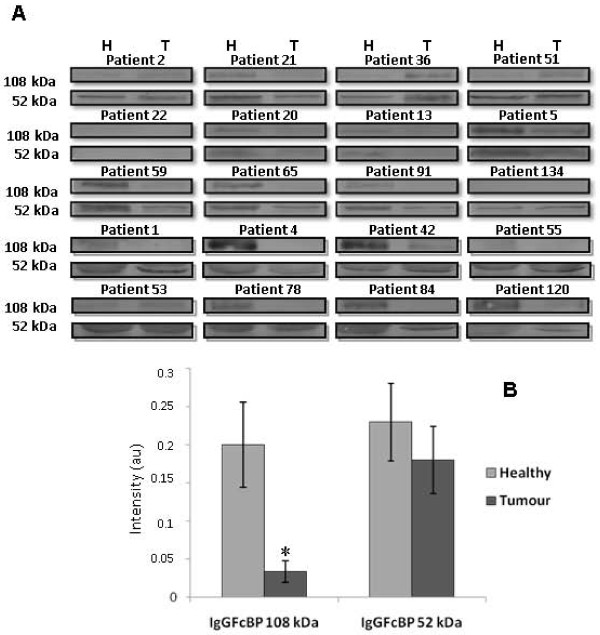
Figure 5.
IgGFcBP expression in healthy and tumour colorectal tissues. (A) Validation of the 1D-SDS-PAGE results for IgGFcBP by immunoblotting in 20-paired samples of healthy (H) and tumour (T) tissue. The Western blot allowed the visualization of two underexpressed isoforms of ~108 and ~52 kDa. (B) For the ~108 kDa band, this decrease was statistically significant. *p < 0.05, according to Wilcoxon's test.

