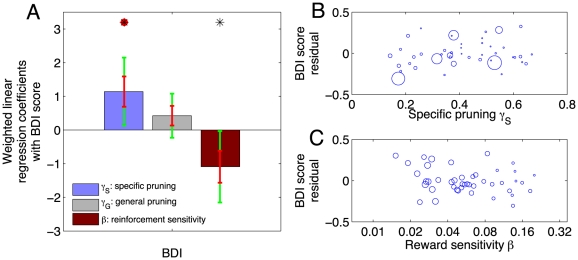
Figure 7. Psychometric correlates.
A: Subclinical depression scores (Beck Depression Inventory, BDI, range 0–15) correlated positively with specific pruning ( ), and negatively with sensitivity to the reinforcers (
 ). Each bar shows a weighted linear regression coefficient. Red error bars show one standard error of the mean estimate, and green errorbars the Bonferroni corrected 95% confidence interval.
  , red dot
  . B,C: Weighted scatter plots of psychometric scores against parameters after orthogonalization.

