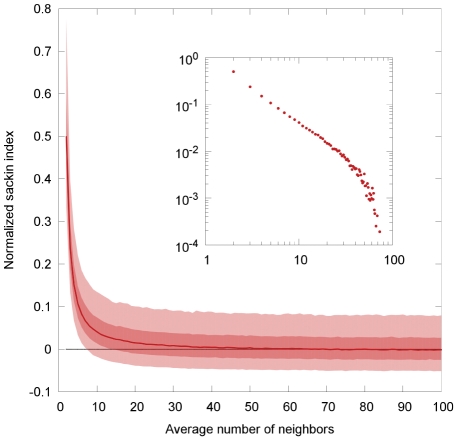
Figure 2. Imbalance (normalized Sackin index) of the infection tree for ER random graphs with varying number of average neighbors.
The light shaded area show the values lying between the 2.5-th and 97.5-th percentile, the dark shaded area those between the 25th and 75th percentile. The dashed line is the expected value of the imbalance for a tree with the same number of leaves under the Yule model (equation (7)). The transmissibility is chosen  . The inset show the same data points on a log-log scale.

