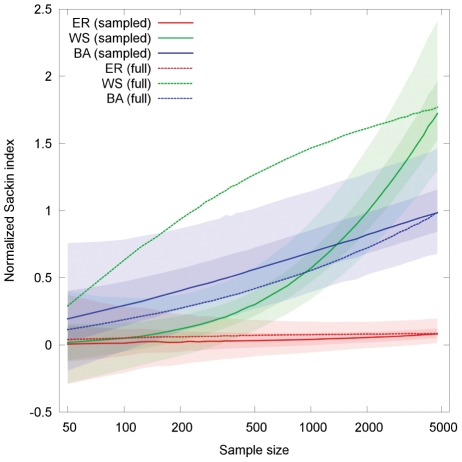
Figure 4. Effect of random sampling on tree balance for infection trees of an ER graph (red), WS graph (green) and BA graph (blue).
The mean degree and the transmissibility are the same for all networks:  and
and  . The rewiring probability for the WS is
  . The solid lines show the median over
  simulations and the light and dark shaded areas the 95% and 50% quantiles respectively. The dotted lines show the median normalized Sackin index for fully sampled trees of size equivalent to the sample size.

