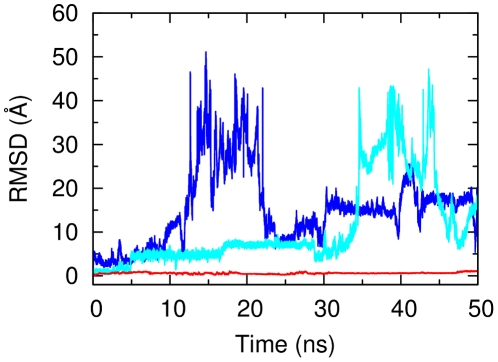
Figure 1. Time series of backbone RMSD from the crystal structure for the CRIPT peptide along MD simulations (residues 0:−4, first 50 ns).
Blue and light-blue curves show two sample unbinding trajectories of the 5-mer peptide CRIPT5. The red curve shows the time series for the longer 9 residues peptide CRIPT9.

