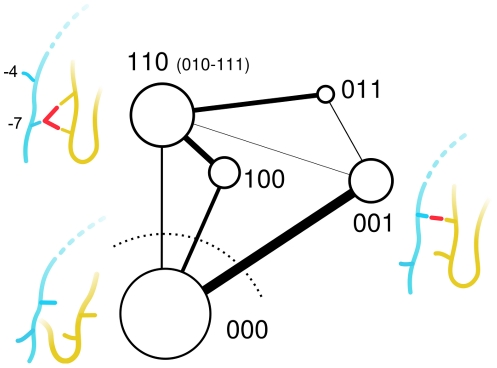
Figure 3. Transition network between the different peptide binding modes.
The  loop, the N-terminal part of the ligand and a schematic representation of the interactions between them are shown in yellow, light-blue and red, respectively. Node surface and edge thickness are proportional to the population of the configuration and the total transition probability, respectively. For each node, the three-letter string of the most populated configuration is indicated. Other minor configurations are shown in parenthesis, when present.

