
Figure 1. Western blot analysis of RNase depletion strains.
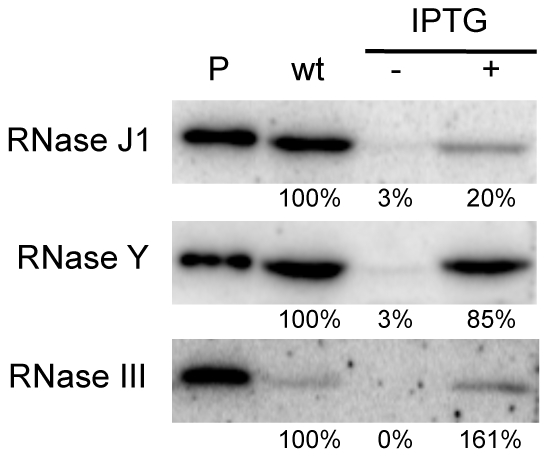
Lane (P) shows signal from 50 ng purified RNase J1, RNase Y and RNase III proteins. Lanes labeled wt and −/+ IPTG show signals from 10 µg wild type and mutant cell extracts grown in the absence and presence of IPTG.