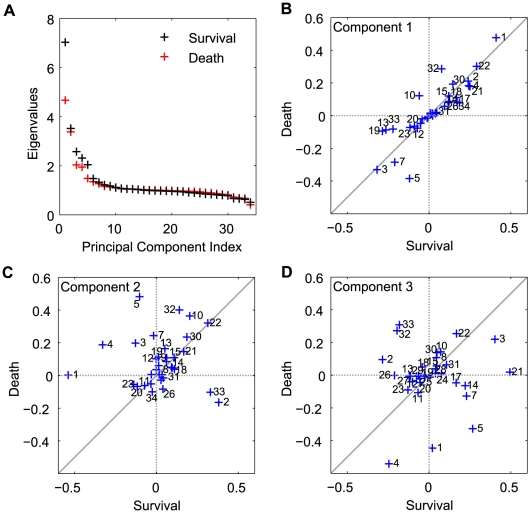
Figure 4. Principal component analysis of the inverse correlation matrix of the parameter ensembles for survivor and non-survivor populations.
(A) Eigenvalues as measures of the total variability explained by each principal component, showing a couple of stiff directions in the parameter space. For each group (survivor or non-survivor), ten thousands parameter sets were randomly sampled from the five million parameter sets of pool and analyzed based on the inverse correlation matrix (approximate Hessian). The coefficients of the linear combinations of the original variables that generate the first (B), second (C), and third (D) principal components were compared between the survivor and non-survivor populations. These comparative plots reveal the differences of the individual parameter's contributions to the first three largest principal components between two groups. The parameters that are contributing up to  in each principal component were indexed.

