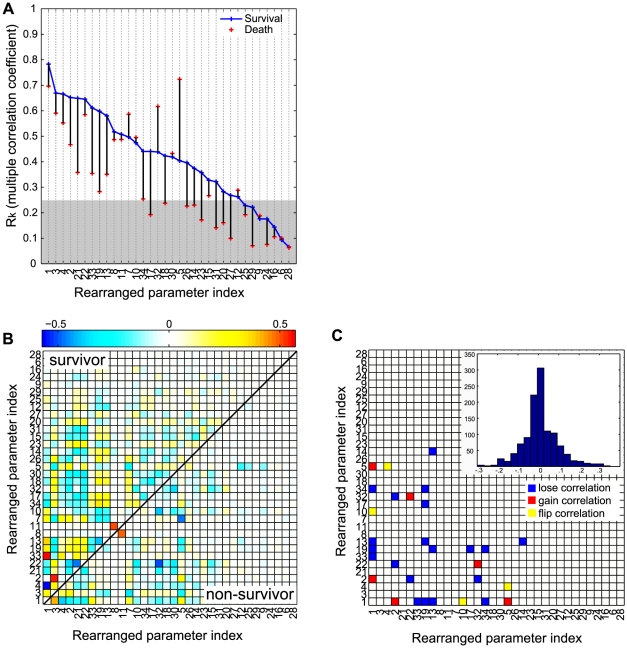
Figure 5. Multivariate correlation analysis of the parameter ensembles for survivor and non-survivor populations.
For each group (survivor or non-survivor), ten thousands parameter sets were randomly sampled from the five million parameter sets of pool and analyzed based on the approximate Hessian matrix (the inverted empirical covariance). (A) The sample multiple correlation coefficient (R) as a measure of the strength of the single parameter's association with the other parameters. The shaded area represents the region below 0.25 that is generally interpreted as weak association. The partial correlations between two parameters are plotted for the survivor population (the upper triangular part in B) and the non-survivor one (the lower triangular part in B). The columns and the rows are rearranged according to the descending order of the multiple correlation coefficients in A. The parameter pairs whose correlations changed significantly between two groups are illustrated in C. The insert is the histogram showing the distribution of pairwise differences of the partial correlation coefficients in B.

