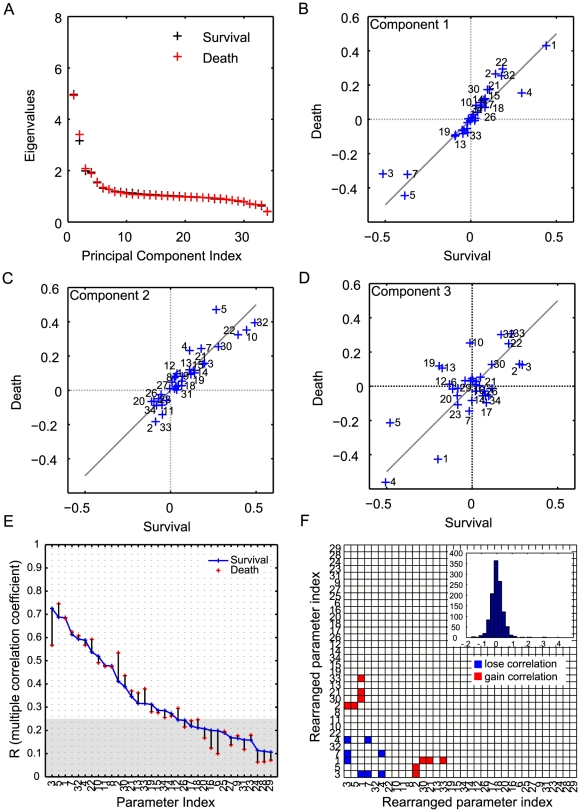
Figure 7. Multivariate correlation analysis of the parameter ensembles for survivor and non-survivor populations after blood purification (HA) treatment.
(A) Eigenvalues plots for the two populations. Ten thousands parameter samples from the non-survivor population before HA treatment (sham) were classified into the survivor and non-survivor ones after the HA treatment. The coefficients of the linear combinations of the original variables that generate the first (B), second (C), and third (D) principal components were compared between the survivor and non-survivor populations after the HA treatment. (E) Multiple correlation coefficients of the two populations. (F) The parameter pairs with significantly changed correlations between two groups are illustrated. The notations are same as Figure 5 D .

