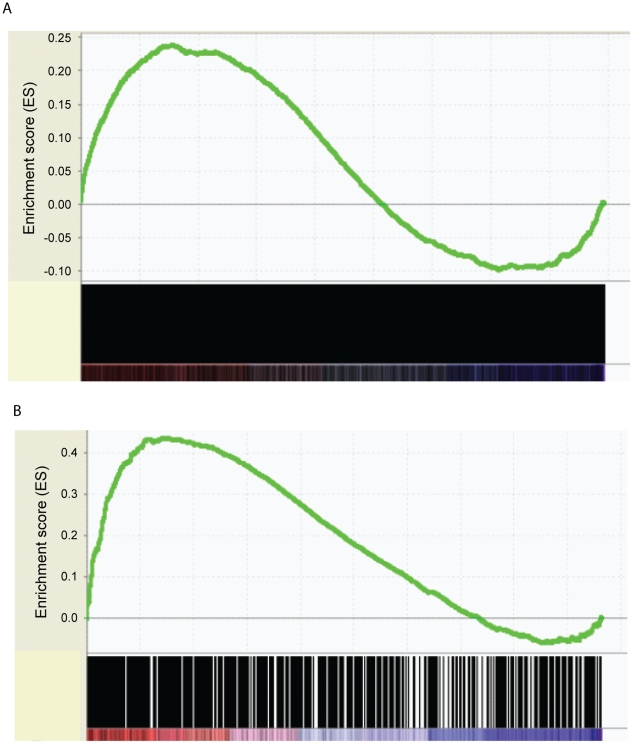
Figure 4. Correlation of transcription factor binding targets with RNA–Seq differential gene expression data by GSEA.
(A). A statistically significant enrichment of TCF7 targets was shown among up-regulated genes in CD34+ cells (Nominal p-value = 0, FDR q-value = 0.02). Differential gene expression was ranked by fold change between Lin-CD34+ cells and Lin-CD34− cells (x-axis). The most up-regulated genes in CD34+ cells are shown on the left side (red), while the most up-regulated genes in CD34− cells were shown on the right side (blue). Black bars represent the positions of genes in the ranked list. Enrichment score (ES, Y-axis) reflects the degree to which TCF7 binding targets are overrepresented at the extremes of the ranked gene expression list. When the distribution is at random, the enrichment score is zero. Enrichment of TCF7 targets at the top of the ranked list results in a large positive deviation of the ES from zero. (B) A statistically significant enrichment of RUNX1 targets was shown among up-regulated genes in CD34+ cells (Nominal p-value = 0, FDR q-value = 0). Enrichment of RUNX1 targets at the top of the ranked list results in a large positive deviation of the ES from zero.

