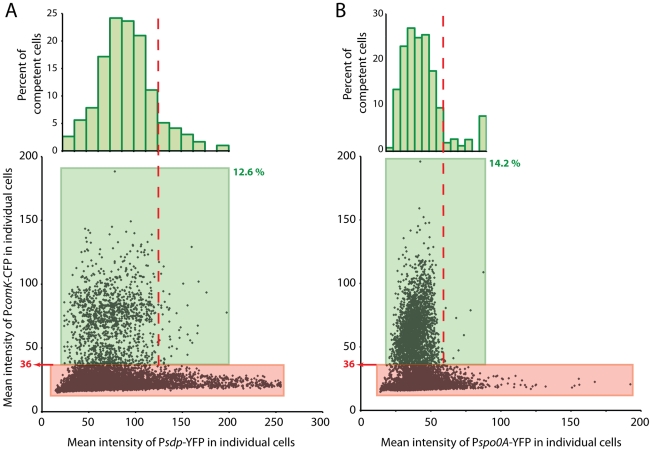
Figure 8. Co-expression of PcomK-cfp.
With PsdpA-yfp (panel A) or with Pspo0A-yfp (panel B). Cells were segmented microscopically and the average pixel intensities in the CFP and YFP channels were recorded for each cell. The green boxes surround competence-expressing cells, with the lower limit of the boxes set from the threshold value (36) derived from Figure 8. These cells comprise 12.6% of the 11,238 cells measured for panel A and 14.2% of the 14,369 cells measured for panel B. The numbers of cells with CFP values in excess of the threshold were deposited into bins and displayed as a histogram, normalized to the total number of cells within each bin of YFP values. These data have been plotted on a histogram as a percent of total competent cells, with similar results (Figure S7).

