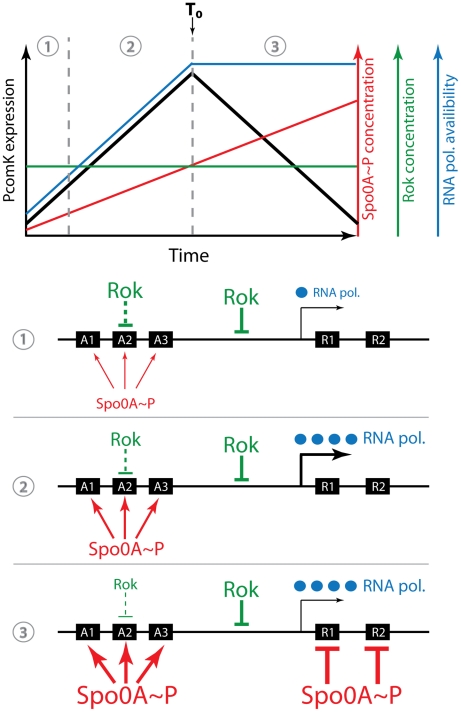
Figure 10. Cartoon of the uptick mechanism.
The top portion of the figure shows a graphical representation of the Rok and OA∼P concentrations, as well as the availability of RNAPol and the rate of comK basal transcription during the transition to stationary phase. (RNAPol availability is used as a plausible stand-in for the cause of the global increase in transcription we have observed). The peak rate of transcription coincides with T0, the time of departure from exponential growth. When the concentrations of available RNAPol and of OA∼P are low (1) Rok is dominant and the rate of comK transcription is also low. As the concentration of OA∼P increases further, Rok is antagonized at sites A1, A2 and A3 and at the same time RNAPol becomes more available. As a result the rate of comK transcription increases (2). Finally, the OA∼P concentration reaches a level that is able to repress at R1 and R2 and comK transcription slows (3). In reality, of course, three demarcated periods of time do not exist. Note that the concentration of Rok remains constant throughout and both RNAPol and OA∼P work to counteract its effects. Rok works at an unidentified site in addition to A1–3, shown here between A3 and R1. For simplicity, the availability of RNAPol is shown as constant after T0, although our data would suggest that it varies somewhat.

