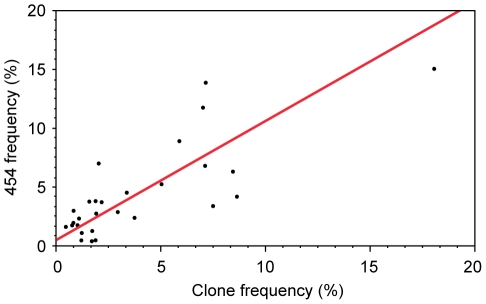
Figure 2. Comparison of sequence variant quantification by 454 deep sequencing and by PCR cloning/sequencing.
Orthogonal regression of variant frequency estimates obtained by 454 and clonal sequence data across the highly variable 1544 nucleotide region spanning Vif to Tat in subject 9213 (slope = 1.01; 95% CI, 0.73 to 1.40).

